

Promotie Lonneke Boels – Interpreteren van grafieken

|
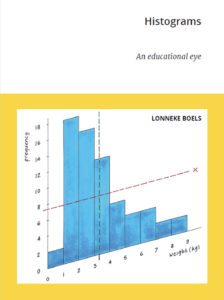
Promotie 20 september 2023: Histograms: an educational eye
Universiteit Utrecht Onderzoek: interpreting statistical graphs and making conjectures from these graphs |
|
Van 2016 tot 2022 werkte Lonneke (o.a. met een promotiebeurs voor leraren van de NWO) aan het onderzoek over het interpreteren van grafieken van statistische data en daaruit zinnige conclusies trekken.
Many high-school students are not able to draw justified conclusions from statistical data in histograms. A literature review showed that most misinterpretations of histograms are related to difficulties with two statistical key concepts: data and distribution. The review also pointed to a lack of knowledge about students’ strategies when solving histogram tasks. As the literature provided little guidance for the design of lesson materials, several studies were conducted in preparation. In a first study, five solution strategies were found through qualitative analysis of students’ gazes when solving histograms and case-value plot tasks. Quantitative analysis of several histogram tasks through a mathematical model and a machine learning algorithm confirmed these results, which implied that these strategies could reliably and automatically be identified. Literature also suggested that dotplot tasks can support students’ learning to interpret histograms. Therefore, gazes on histogram tasks were compared before and after students solved dotplot tasks. The “after” tasks contained more gazes associated with correct strategies and fewer gazes associated with incorrect strategies. Although answers did not improve significantly, students’ verbal descriptions suggest that some students changed to a correct strategy. Newly designed materials thus started with dotplot tasks. From the previous studies, we conjectured that students lacked embodied experiences with actions related to histograms. Designed from an embodied instrumentation perspective, the tested materials provide starting points for scaling up. Together, the studies address the knowledge gaps identified in the literature. The studies contribute to knowledge about learning histograms and use in statistics education of eye-tracking research, interpretable models and machine learning algorithms, and embodied instrumentation design.
Video from 2019
Statistical literacy. Conceptual difficulties when interpreting histograms: A review, 2019
Zie ook een Online Seminar by Lonneke Boels uit 2019.
Boels, L. (2023). Histograms. An educational eye (Publication Number FI Scientific Library 117) Utrecht University. Utrecht.
Verwijzingen
- uu.nl/staff/lbmmboels
- Boels, L., Alberto, R. & Shvarts, A. (2023). Actions behind mathematical concepts: A logical-historical analysis. CERME13, Budapest, Hungary.
- Boels, L., & Van Dooren, W. (2023). Secondary school students interpreting and comparing dotplots: An eye-tracking study. PME46, Haifa, Israel.
- Garcia Moreno-Esteva, E., & Boels, L. (2023). Histogram recognition: An algorithmic model of eye movement. Earli, Thessaloniki, Greece.
- Boels, L., Alberto, R., Dulam, T., & Hoogland, K. (2023). Citizens’ use of contemporary data in their daily life and work. The Thirteenth International Research Forum on Statistical Reasoning, Thinking and Literacy (SRTL-13), Maleny, Australia.
- Boels, L. (2023). Reflections on gaze data in statistics education. Teaching Statistics. https://doi.org/10.1111/test.12340
- Boels, L., & Shvarts, A. (2023) Introducing density histograms to Grades 10 and 12 students. Design and tryout of an intervention inspired by embodied instrumentation. In G. Burrill, L. de Oliveria Souza & E. Reston (Eds.) on reasoning with data and statistical thinking: International perspectives. Advances in Mathematics Education. Springer Nature.
- Boels, L. B. M. M., Bakker, A. and Drijvers, P. H. M. (2019). Unravelling teachers’ strategies when interpreting histograms: an eye- tracking study (PDF) In U. T. Jankvist, M. Van den Heuvel-Panhuizen and M. Veldhuis (Eds.), Eleventh Congress of the European Society for Research in Mathematics Education. Utrecht.
- Boels, L. and Bakker, A. a. (2019). Conceptual difficulties when interpreting histograms: A review Educational Research Review, 28, 100291. doi:10.1016/j.edurev.2019.100291 .
